The squat bar is the last battle of the bulls and bears with lots of buying and selling with a little price movement. We label the squat bar because it appears the market is squad and getting ready to leave one way or the other. Around 80 to 85% of the time a trend with the squat bar is one of the top or bottom three bars.
If it is not a trend ending squat, it becomes a measuring squad similar to a measuring gap: predicting how far the current trend will move. Squats are characterised by greater tick volume compared to the previous bar only so it’s range/volume and that answer compared to the previous bar.
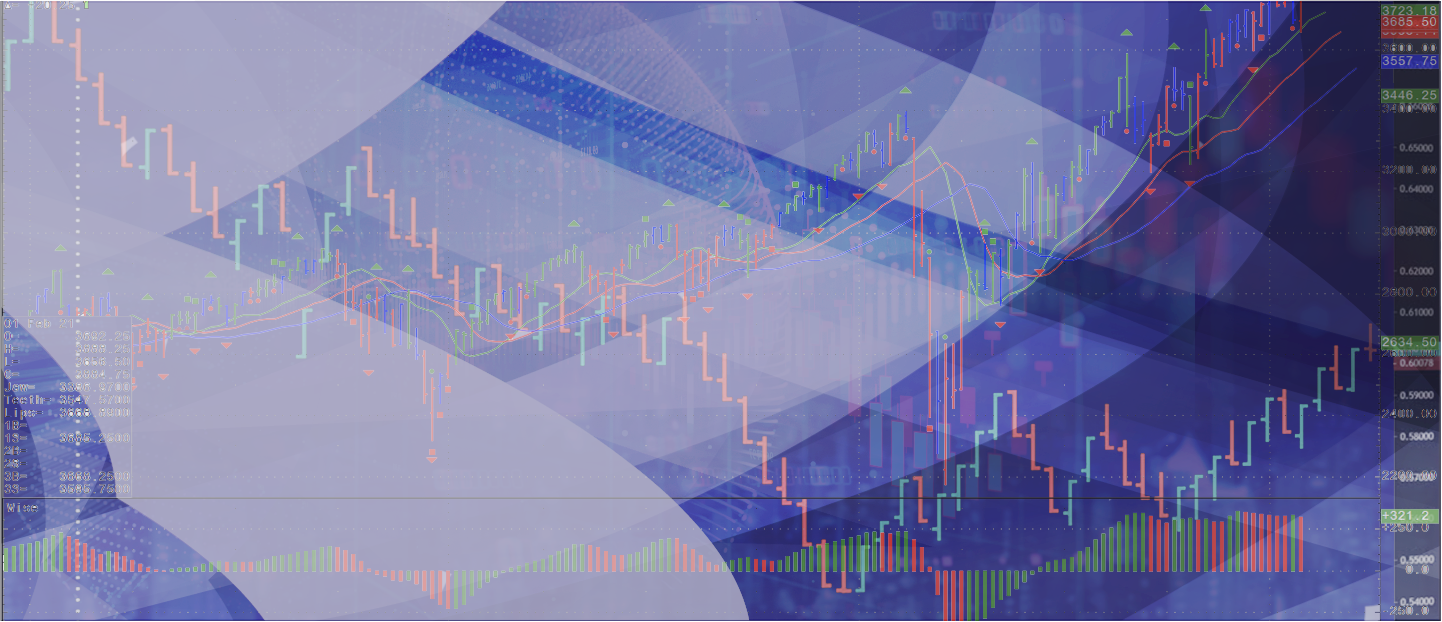
Let us take a look on a chart at a live example:
You have red price bars, green price bars, and blue price bars. The BLUE bars represent the squat bar. Either trend ending or measuring (measuring to be covered in another video). Looking at this chart you’re going to notice that there are squat bars present as this market goes back and forth changing directions multiple times. And the squat bars were there as one of the top or bottom three bars at least 80% of the time.
This top bar has a squat next to it, that is counted as one of the top three bars. Next, you see the bottom bar is a squat bar, and so forth in this Gold market. Some of the squat bars will be present for a small change in trend and others will be a major change in trend. This is just one of the tools we use to help identify changes in trends and how to enter a market.
For more information contact our office.
May All That You Wish For Be The Least you Receive